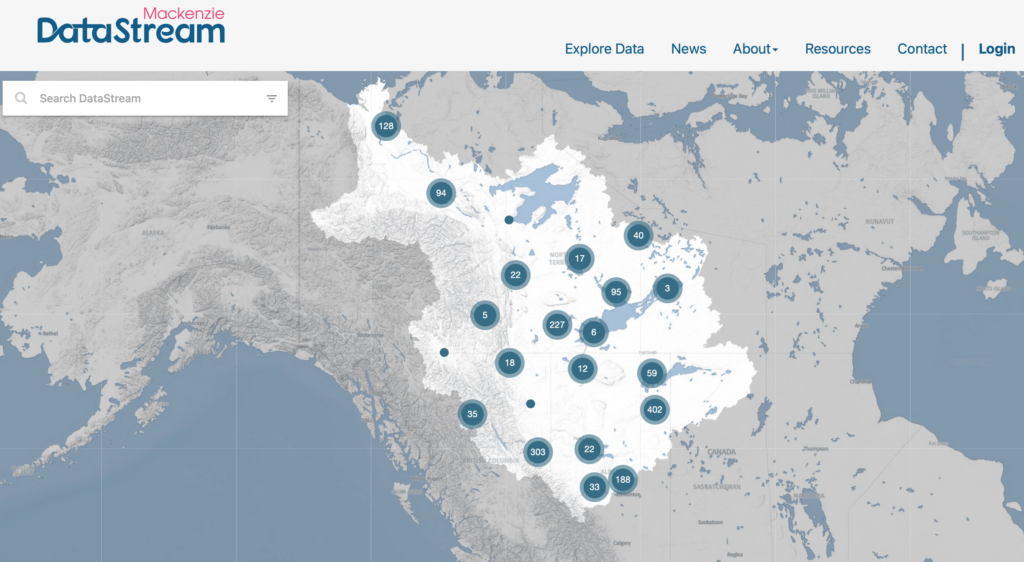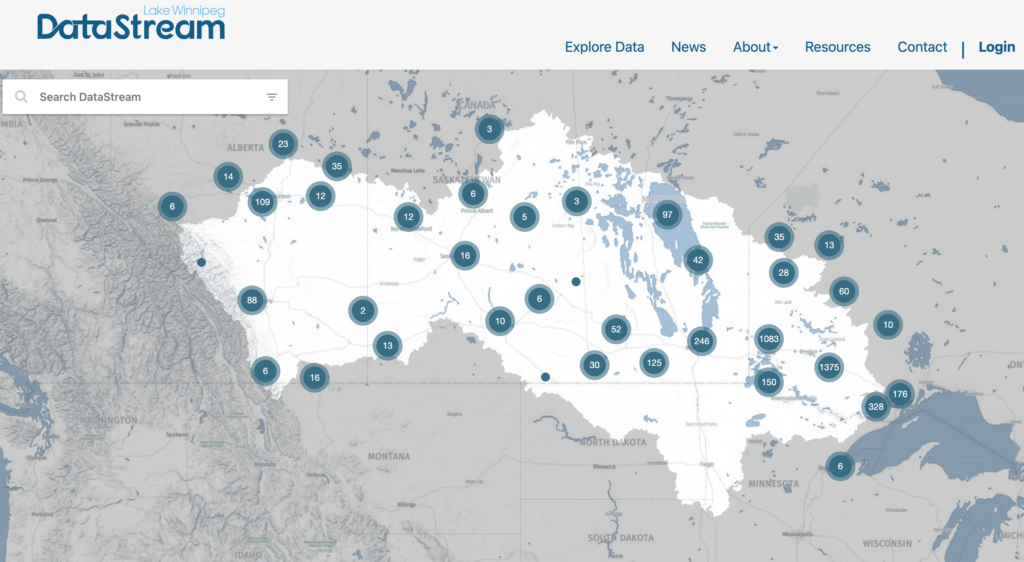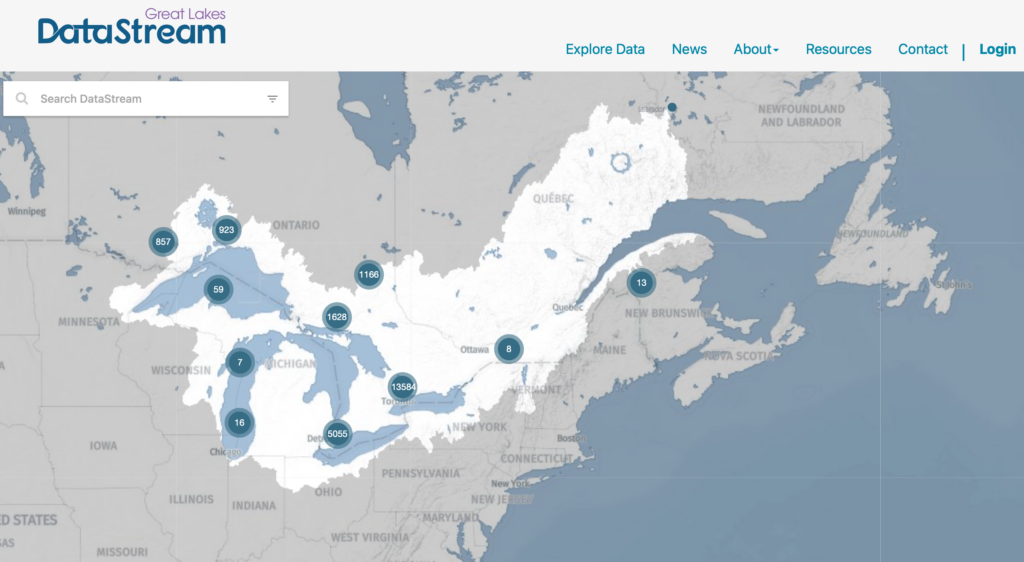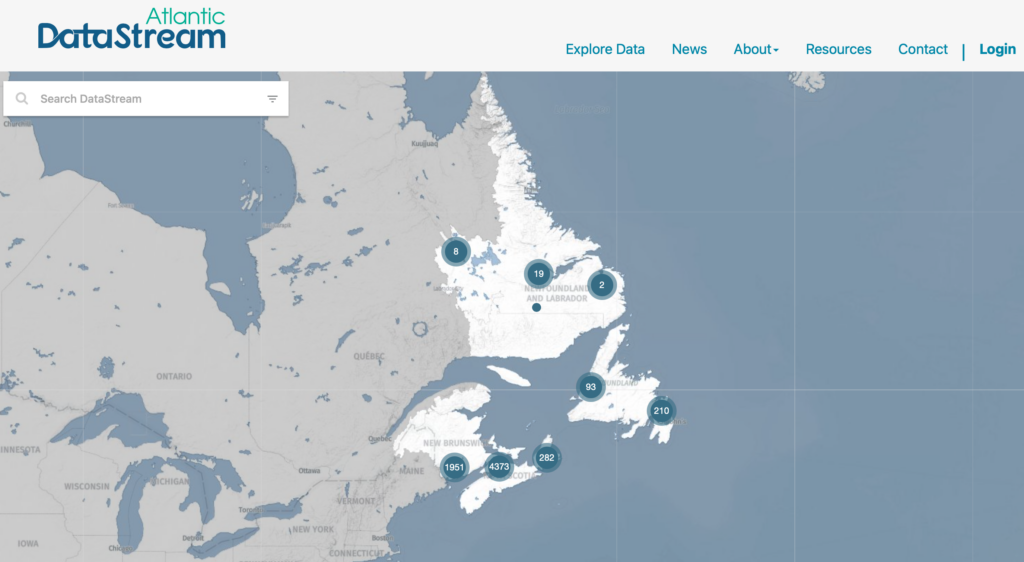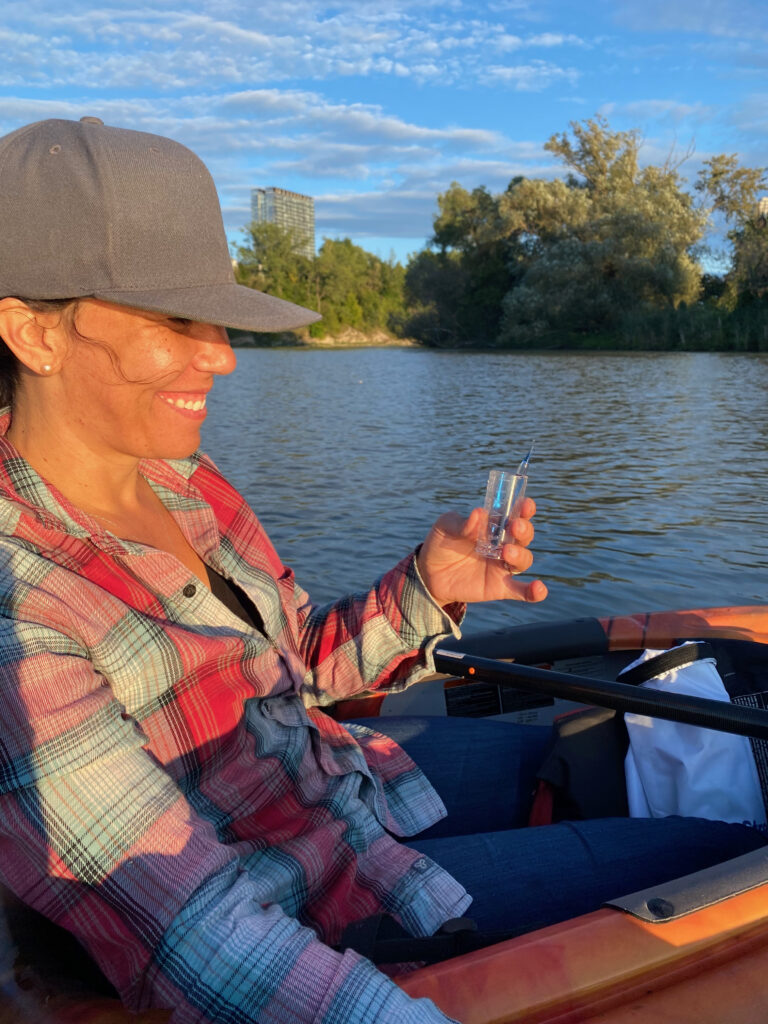
Carolyn DuBois lives in the Toronto area. She loves her home, and has a soft spot for the Humber River. As the Executive Director of the Water Program for the Gordon Foundation, she’s been a key player in the expansion of DataStream, a platform for sharing open data on freshwater health. I spoke to Carolyn just as Great Lakes DataStream launched online. The Great Lakes represent the fourth hub on a platform that also includes the Mackenzie River Basin, Lake Winnipeg Basin, and Atlantic Canada. I could see and hear Carolyn’s happiness about this amazing accomplishment.
*(The following text from our conversation has been edited for length and clarity, but I have retained Carolyn’s voice throughout.)*
I started off asking Carolyn for some of the back story behind Great Lakes DataStream.
Carolyn: “It was about nine years ago we started building Mackenzie DataStream as a collaboration with the government of the Northwest Territories. In the beginning, we didn’t think we were going to do more than Mackenzie. But, as we started to see that communities across the whole country were having similar challenges around access to data, we saw that this model worked elsewhere.
I want to emphasize that there’s lots of great data work happening, but there was a need to pull together data in the Great Lakes in the way that DataStream does. This means pulling together water quality data from various sources. We got some support from Environment and Climate Change Canada and RBC Tech for Nature, and we came together last year with Lake Futures at the University of Waterloo, to bring together stakeholders who work with data in the Great Lakes region. From there, we started building the platform.”
Next, I wanted to hear what Carolyn enjoyed most about this process along the way.
Carolyn: “For me, it is always the people. It’s getting to know all of the amazing work that’s happening around water monitoring and research, and finding enthusiastic and passionate allies who really want to see data used. And ultimately, the point is to inform more collaborative decision making and raise the profile of community efforts.
There are some great allies in the Great Lakes region – we LOVED working with Water Rangers! The collaboration came together so fast, and it’s been so cool getting to see some Water Rangers’ groups come online. We’ve facilitated a connection between our systems so that their groups can automatically contribute to Datastream.
It’s also been really fun to see data points come in from places on my own stomping ground. When I demo Datastream now, I can show data points from my childhood home close to the Humber River.”
And then I asked her about the challenges.
Carolyn: “I think there’s a challenge around data volume. There’s a lot to do and we’re still a small team. To try to sort through and tease apart how all of these initiatives connect – what are the right entry points – it’s complex. That has been a challenge and we will never be done! That’s kind of how Datastream works, and it’s fine, I like it.
We’re also releasing during COVID. That’s a really big change, and it has been hard. One of the things we’ve done in every other region is go meet with people and sit down with community groups. We did some Zoom convening, but it’s not the same. Right now, this online release is like a soft launch. Our plan is to have a public, in-person celebration and official launch next year, when we can do more around the convening side of things. DataStream is a platform and it brings data together, but we also bring PEOPLE together. When you convene like that, all kinds of other things happen that are far outside the data. We haven’t had the opportunity for some of that serendipity to happen in a virtual setting.”
I was curious to know if the pandemic has actually resulted in any positives.
Carolyn: “During COVID, people had more time to dedicate to cleaning house so to speak, and get their data organized and shared on DataStream. This was a negative in the sense that they weren’t out monitoring – especially the first summer – but people spent more time working on data. The other positive part is that we had to strengthen our own systems. Had we been travelling, that focussed work would have taken us longer.”
Finally, we chatted about where Great Lakes DataStream, and ALL the DataStream hubs, are heading in the future.
Carolyn: “Somebody asked me if there is a lot more data to get in the Great Lakes…The answer is a huge YES! This is the tip of the iceberg, and that’s an open invitation – we want to hear from people. We’re dedicated to working with groups who have data, and we’re good at doing this kind of work.
And stay tuned – we’re saying publicly that we are eyeing pan-Canadian expansion in the next few years. So DataStream will be available in the whole country!”
If you have data you want to share on Great Lakes DataStream or have questions about it, please contact datastream@gordonfn.org.
