2022-23 Annual Survey Results

As Our Living Waters grew over the past few years, we adapted our services to meet the changing needs of our Network members. This year, the annual survey gauged the value of these adaptations by evaluating Network health.

We had a great response! A total of 82 organizations filled out the survey, representing 64.5% of the OLW Network’s organizational members.

As of March 2023, OLW had 182 members (including 127 organizations and 55 individuals). Of the 127 organizations, many work in all watersheds across Canada, while others focus on local or regional scales. Not surprisingly, the most populated watersheds are best represented by Network members. The chart to the right shows the distribution of OLW Network members across six major drainage regions in Canada, as defined by Statistics Canada’s map(The total exceeds 127 because some organizations work in multiple watersheds).
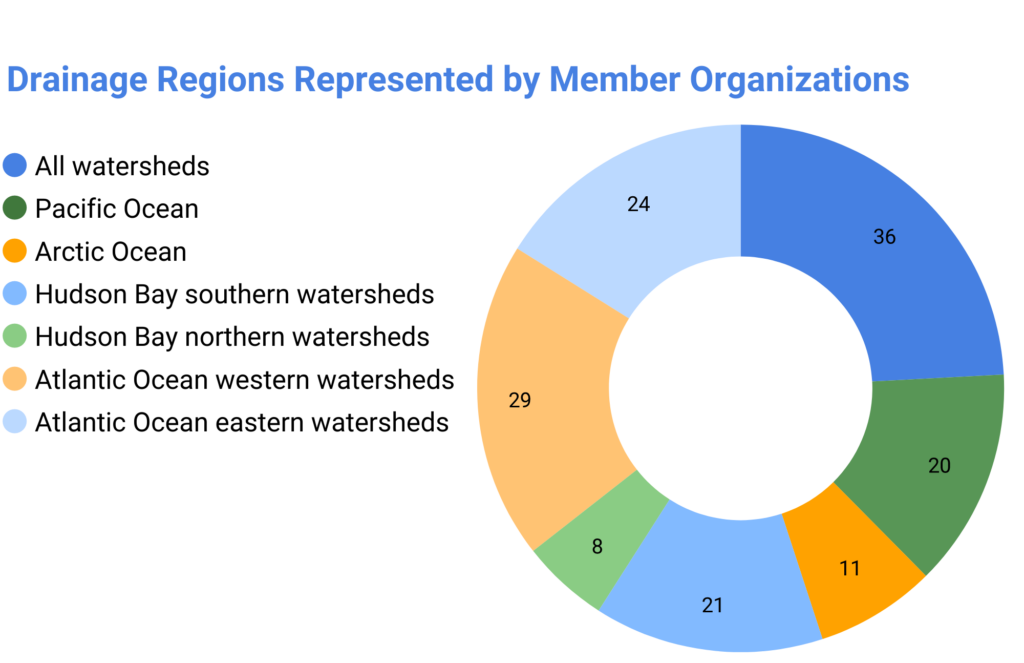
Alt text: A pie chart titled Drainage Regions Represented by Member Organizations displays different regions in various colors. The segments are as follows: Blue for All watersheds with 36 parts, Green for Pacific Ocean with 11 parts, Orange for Arctic Ocean with 21 parts, Light blue for Hudson Bay southern watersheds with 8 parts, Gold for Hudson Bay northern watersheds with 29 parts, Olive for Atlantic Ocean western watersheds with 24 parts, and Light green for Atlantic Ocean eastern watersheds with 20 parts.

Canadian French Translation: Graphique à secteurs intitulé « Régions de drainage représentées par les organisations membres ». Sections : Bleu (Tous les bassins versants, 36), Vert (Océan Pacifique, 11), Orange (Océan Arctique, 21), Bleu clair (Bassins versants sud de la baie dHudson, 8), Or (Bassins versants nord de la baie dHudson, 29), Olive (Bassins versants ouest de locéan Atlantique.,24) vert clair / Bassins versants est de locéan Atlantique ,20.

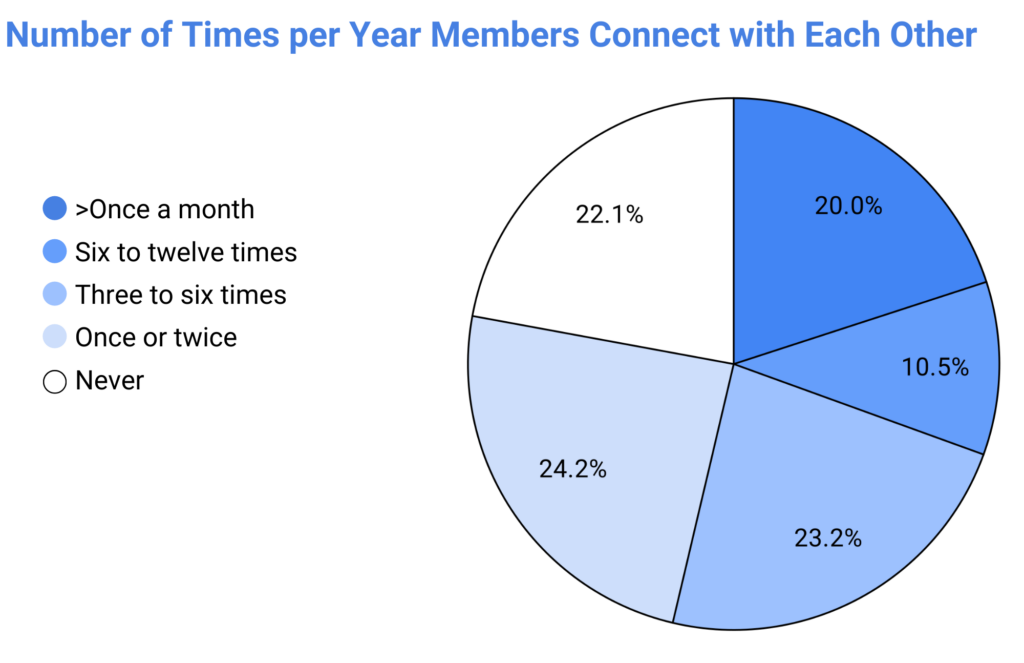
We also asked how connected OLW Network members are with each other. In the two charts below, you can see that about one third of members know more than five other organizations and also connect with each other at least once every two months. As a result, we recognize the need to continue our networking efforts to target this third of actively involved members, and/or adapt our future efforts to better connect less engaged members in the Network.
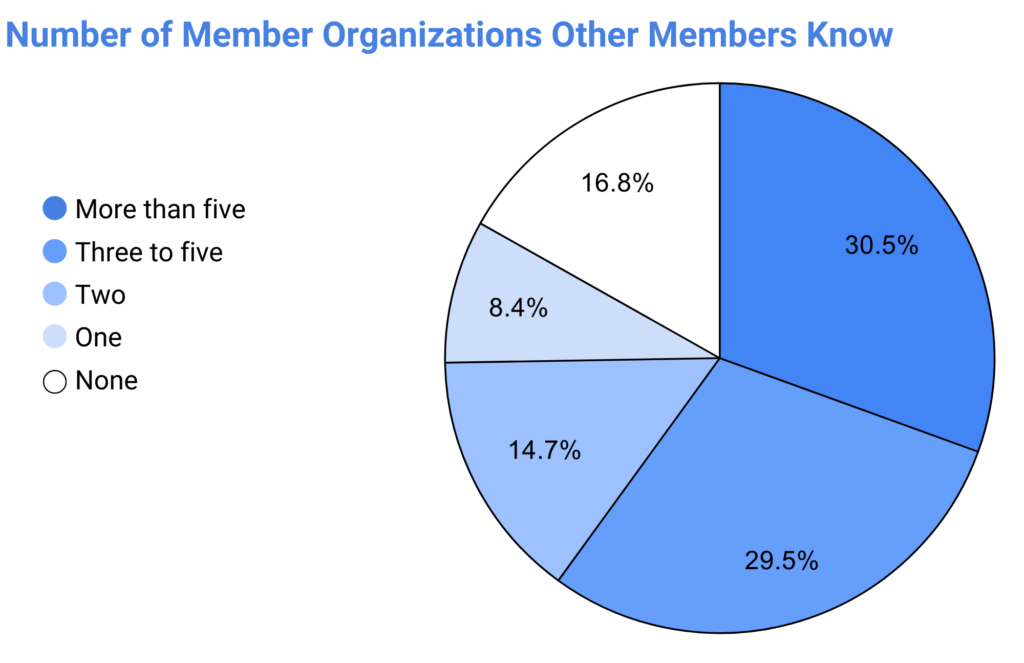
Alt text: A pie chart illustrating how many member organizations other members know. Sections include: More than five (30.5%), Three to five (29.5%), Two (14.7%), One (8.4%), and None (16.8%). / Un graphique à secteurs illustrant combien dorganisations membres les autres membres connaissent. Les sections incluent : Plus de cinq (30,5 %), Trois à cinq (29,5 %), Deux (14,7 %), Un (8,4 %) et Aucun (16,8 %).
Alt text: A pie chart titled Number of Times per Year Members Connect with Each Other. It shows: Once a month (20%), Six to twelve times (10.5%), Three to six times (23.2%), Once or twice (24.2%), and Never (22.1%). / Un diagramme circulaire intitulé « Nombre de fois par an que les membres se connectent entre eux ». Il indique : Une fois par mois (20 %), Six à douze fois (10,5 %), Trois à six fois (23,2 %), Une ou deux fois (24,2 %) et Jamais (22,1 %).

Network members also identified which of our services are most valuable to their own organizational goals. As you can see in the chart to the right, we found that a small core group of Network members uses our services; of these people, most find that our services have medium to high value in amplifying the impact of their organization. Again, we recognize the need to adapt our service delivery in light of who is using which services and to what end.

Finally, OLW members helped us imagine the Network’s future. Although there were many suggestions, we heard resounding support for OLW to continue in the role of a bilingual national network weaver, coordinator, facilitator, connector, unifier, convener or partnership builder.

We are so grateful for the different ways all of our members contribute to the Network, and we hope you stay tuned for more updates on our future visioning!
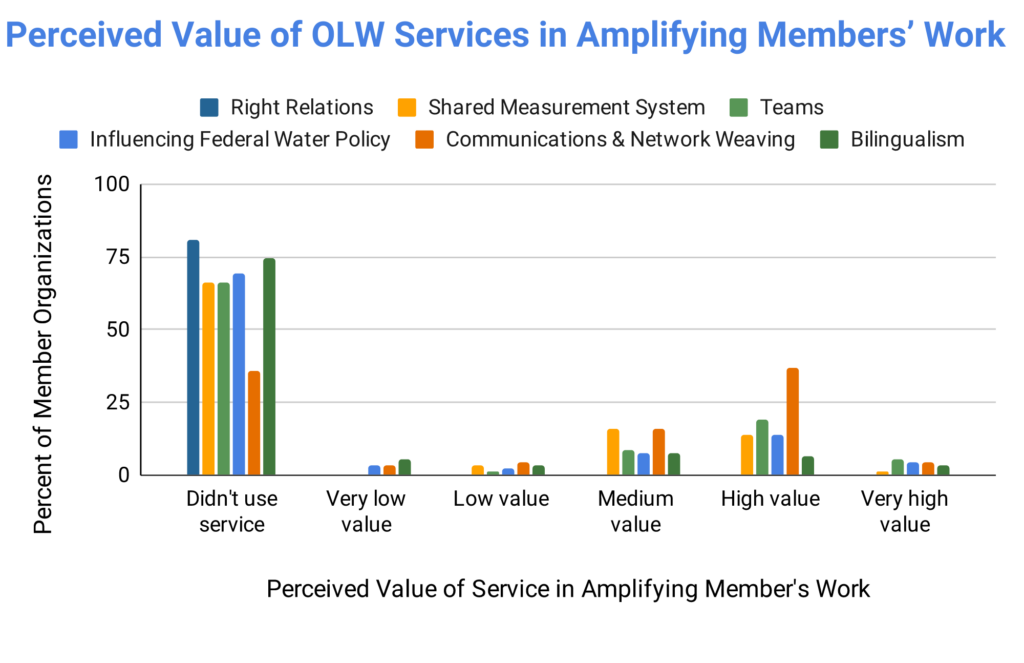
Alt text: Bar chart titled Perceived Value of OLW Services in Amplifying Members’ Work shows member organizations ratings. Color-coded bars represent six services: Right Relations, Shared Measurement System, Teams, etc., across different value levels ranging from Didn’t use service to Very high value. The chart highlights how each member organization values these services.

Canadian French Translation: Texte alternatif : Histogramme intitulé « Valeur Perçue des Services OLW dans lAmplification du Travail des Membres » montre les évaluations des organisations membres. Les barres colorées représentent six services : Relations Justes, Système de Mesure Partagée, Équipes, etc., à travers différents niveaux de valeur allant de « Na pas utilisé le service » à « Valeur très élevée ». Le graphique met en évidence limportance accordée par chaque organisation membre à ces services.
Scroll to Top